[Bitop Review] Daily Crypto Analysis: BTC, ETH, SOL
2024年10月16日发布

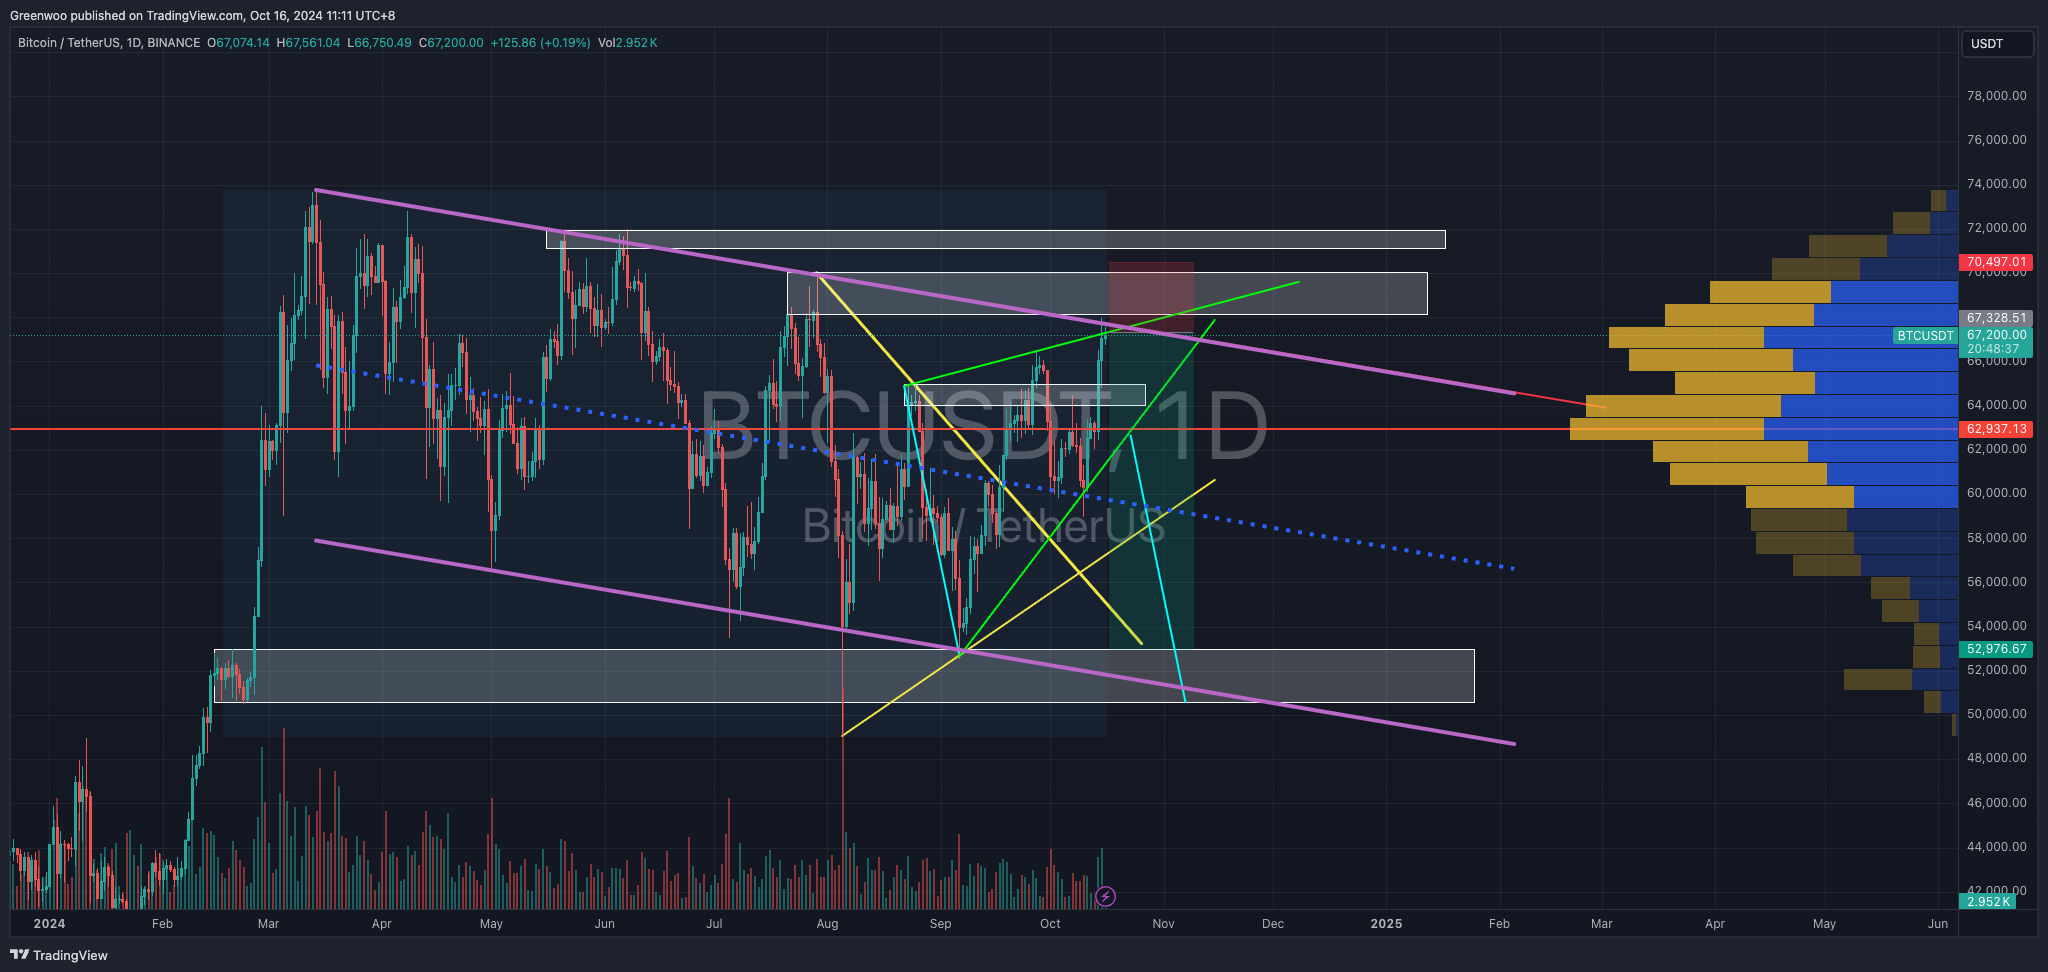
After breaking through $66,000 on Monday, BTC continued its upward momentum, surpassing $67,000 yesterday. It peaked at $67,950 before retracing, currently trading at $67,156, representing a 2.48% increase in the past 24 hours.
Although BTC's performance seems impressive, a longer-term perspective reveals a downward trend since it breached its all-time high on March 14th. The price has been oscillating within a descending parallel channel (purple parallel lines on the chart). Recently, a bullish triangle pattern (green lines) has formed, which is often considered a bearish signal. If the price breaks below the lower green trendline, the initial measured move target is around $50,500 (blue line).
Further analysis shows that the current price is situated at the lower boundary of the descending trendline within the parallel channel and near the edge of the green triangle, indicating significant resistance at this level. Therefore, the Bitop market analysis team anticipates a downward price movement from this point.
Typically, there are two approaches in such a scenario:
Enter a short position now: Set a stop-loss above the trendline and target a price range of $50,500 to $53,000. This is a more aggressive and contrarian strategy.
Wait for the price to break below the lower trendline of the triangle: Enter a short position after a retest, aiming for the same target range of $50,500 to $53,000. Place a stop-loss 3-5% above the retest level.

ETH's stagnant trend has shown slight improvement following the September interest rate cut, but the overall direction remains downward. It is currently trading at $2,616, with a 0.14% increase in the past 24 hours.
The price has formed an isosceles triangle, typically an accumulation pattern indicating a potential continuation of the previous trend. Therefore, the trading strategies for ETH are similar to BTC: enter a short position now or wait for a breakdown below the triangle. Set a stop-loss above the previous high at $2,727. Target prices include the blue line on the chart and the subsequent level at $2,112 (red line). Investors can take partial profits at these levels and set protective stop-loss orders.

SOL's price movement has aligned with previous predictions. After reaching our forecasted target of $160, it began to decline and has been consolidating between $135 and $160. It is currently trading at $154, down 0.97% in the last 24 hours.
This range-bound movement is ideal for short-term traders. Simply establish long and short positions at the upper and lower boundaries of the range, respectively, and set stop-loss orders just outside the range. Those who followed our previous advice should have already realized at least an 13% profit without leverage.
However, there are some concerns. The price has gradually shifted from a rectangle to a triangle pattern, with a declining upper boundary, indicating weakening bullish sentiment. While we don't anticipate a sharp decline, investors should closely monitor the market to mitigate potential risks.
Disclaimer: None of the information contained here constitutes an offer (or solicitation of an offer) to buy or sell any currency, product or financial instrument, to make any investment, or to participate in any particular trading strategy.